
-

We're here to help
- (844)783-3800
- sales@fullspectrumsolutions.com
-
 0
0
0
Changes in modern offices and their interior environment have modified the interior design practices of today’s designers. Interior design objectives for open-plan offices with solid and or opaque materials with various fabric colored covers, glass, translucent or transparent cubicles and everything in between are now often used in an attempt to improve the environmental health, communication, and make better working environments. The variations in size and the height of partitions or ceiling materials are also used to provide flexibility in control of the variables influencing the working environment.
These changes affect the occupants and their physiological or mental effectiveness during the working hours, which are a major concern of the office management at large office organizations. The office exterior and interior environmental conditions would affect the attitudes and behavior of the users in an office environment. Day lighting, lighting, thermal comfort, indoor air quality acoustics, and space layouts are the key variables in design for interior working space. This study focuses on the specific research to provide guidance on designing the lighting system in an office that will meet employees' needs and support organizational productivity.
As part of good lighting design practices, a luminous environment should be optimally viewed when acuity is best, under a healthy lighting system. There is a growing demand for data related to spectral variability of light and its influence, not only on vision, but also on all other architectural surfaces along with the user interaction in a given space. Rapidly emerging areas of science require lighting system characteristics to be identified for quality, spectral, special distribution, timing and duration. Current designs for buildings and related systems do not meet the demands for optimal performance, visual comfort, energy efficiency, healthy lighting and high standards in aesthetics at the same time. There are no clear criteria for the light that enters the eye or reaches the retina under dynamic day lighting and or controlled lighting conditions. This is true not only for people but also there are no criteria for plants and animals. This study and thoroughly documented laboratory experiments shown in various case studies bring into focus the need for relevant data to quantify and validate or assess the performance of these effects, and to enhance our design capabilities [1]. Current studies show an increased interest on spectral content of light. Light with blue spectral content has been a major focus of their research objectives. Results show this portion of the spectrum is more visually efficient for perceived brightness and visual acuity, therefore a luminous environment with scotopically or cirtopically rich content will provide efficient lighting system.
The studies in health science and vision show spectral response to circadian regulation with peak wavelength in 480-485 nm regions adding more evidence to support the role of the photoreceptors in circadian regulation. The applied physiology studies show that performing an exiting or active task on video display terminal with bright display suppresses the nocturnal changes on melatonin concentration and other physiological indicators of human biological clock [2]. The bright lights of 2000 lx or even lower light of 300-200 lx from fluorescent lamps can inhibit nocturnal melatonin concentration in adolescents [3-5]. Subjective drowsiness is higher under 3000K° lighting condition than 5900K°, lower CCT illumination can be used effectively in an environment where lower physiological activity is desired. Office workers spend over 90 percent of their daytime indoors and as results do not receive enough exposure to this portion of the spectrum. It is necessary to examine the visual performance and related lighting design, and control strategies with consideration of the circadian influence in architectural lighting design to optimize or maximize the physiological influence and health [6-8].
Results are reported here of 3 studies of near visual acuity (normal reading distance of about 18 inches) under realistic conditions of task and surround lighting. The surround and or general fluorescent lighting is either low (3500 CCT) and high (5000 CCT) along with high (5900 CCT) task lights. The office workers participated in an experiment where their primary tasks were a paper based task on a horizontal desk top and the secondary tasks were on a vertical self luminous computer screen. The office workers using the telephone obtain the information and record the data on the horizontal task paper, after evaluation of the information the results are input into the database and viewed on the computer screen.
The participants in these studies were 33 young office workers. In order to provide different task and surround lighting conditions, the visual task, either Snellen letters or words of varying size, rested on a small size light table that were lit by general lighting system. An office partition with fixed height and their layout were positioned as such to not interfere with the task being lit by other lights such a new task lighting if it was utilized. To prevent the task lighting from illuminating the surround walls, they were aimed right at the paper task. The surround lighting conditions were adjusted so that equal photopic illuminance was provided at the eye for the two color temperature lightings for before and after.
Task luminance varied between about 34 and 398 Nits (cd/m2) [10 and 116 fl (cd/ft2)], illuminance on the task plane varied between 184 and 1261 Lux (lm/m2) [17 and 117 fc (lm/ft2)] and illuminance in the subjects’ eye varied between 129 and 961 Lux (lm/m2) [ 12 and 89 fc (lm/ft2)]. The existing lighting system was used to establish the base case for evaluating office workers acuity under realistic working conditions.

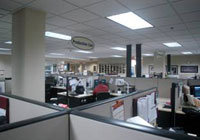


For study Before and After, there were two visual tasks. One utilized several Snellen letter charts of 24 black letters on white paper (size 8.5 in. by 11 in. or 21.59cm by 27.94cm) of decreasing size letters going from top to bottom in 5 horizontal lines with 4 letters on lines 1 & 2, 5 letters on lines 3 & 4 and 6 letters on line 5. Direct measurement of the letter size heights indicated that they ranged from approximately 9 points to 1.6 points (1 point = 1/72 in. or .035278 cm). Mean letter and word sizes were obtained by averaging over all letters and words in a given line For the conditions of the study, a participant who read correctly all the letters in the last line would have at least 20/15 near visual acuity and for the next to last line 20/25 near visual acuity. The second visual task utilized in the study, consisted of several charts of the same overall size and material as the letter chart but contained 81 common simple but unrelated words of gradually decreasing size (Bailey-Lovie word charts). The word sizes ranged from 1.4 points to 22 points and a person able to read all the words would have at least 20/13 near visual acuity. The letter and word sizes were obtained using a highly calibrated microscope accurate to 0.0001 mm. The participant simply replaced their immediate task surface in use with the chart under testing. For the testing, subjects sat in a chair, leaned slightly forward and viewed the charts at a fixed distance of 18 inches (45.72cm) between their eyes and the charts (approximate typical reading distance). They were asked to read aloud the letters or words and the experimenter recorded the total number of correctly read letters or words. Figure 3 shows the task area of each workstation.

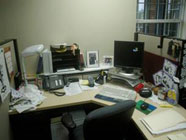
Figure 3 - A view office interior workstation (Before and After)
The scores were based on the number of words (Max=81W) or letters (Max=24L) read by the subjects correctly. To assure that the visual distance was maintained, the experimenter monitored the subject’s posture during the visual test. Typically, the subject head position was inclined forward about 25 degrees with respect to the vertical. The Figures 4 shows the utilization of the task lights by the subject during their working hours and the subject at a typical posture for the study TA.

Figures 4 - The subject at a typical posture using the task lights.
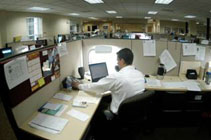
Task light was essentially prevented from striking the surround walls by the use its shield and its location on the table with an arrangement that is shown in Figure 5. This was an attempt to minimize the surround room lighting from affecting the task luminance in the direction of subject gaze. The maximum and minimum task luminance used with the task lighting arrangement was about 64 to 250 (cd/m2) or 19 to 73 (cd/ft2) respectively. For study B and A, the letter and word charts were used. For the TA study, the set up was the same as study B and A except an additional condition was added where the surround lighting was impacted by the addition task lighting except for three stations with some amount of incoming daylight. See Figure 6 for the areas were daylight was reaching the task.

Figure 5 – Task light arrangement for the study TA


Figure 6 – Workstations with incoming daylight
For all test lighting conditions before and after, acuity was highly significantly better for the high color temperature surround lighting as compared to the low color temperature surround. The results show that visual acuity depends on the color temperature of the surround lighting. The data shows that to obtain equality of visual acuity under the 2 different surround spectra requires at least 300% more task luminance when the surround lighting is provided by the low color temperature lighting as compared to the high color temperature lighting. Study shows that word reading and letter acuity were significantly better when the room general lighting at (5000K CCT) and or task lighting were provided by lamps of high color temperature (5900K CCT).
Figure 7- shows a plot of the mean score data of the test conditions and of all studies

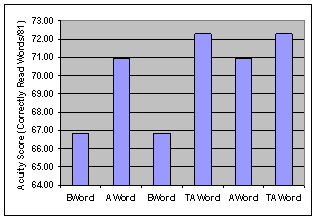
The results clearly demonstrate that acuity is significantly better for the high color temperature surround lighting than the low color temperature lighting at equal photopic illuminance at the eye. More elaborate statistical analyses could be undertaken such as a MANOVA procedure but because of the very high level of significance provided by the T-tests it is doubtful that whether any additional conclusions would occur. [9-14].
More importantly, as is readily seen by examination of Figure 7, equality in acuity between the two different surround spectra and just the use of task light requires at least 300 % more task luminance under the low color temperature surround lighting than under the lighting. As can also be readily seen from figure 7, there is no value of the task luminance under the low color temperature surround lighting that will produce the maximum acuity achieved with the high color temperature surround. The implication of this result for lighting practice is that lighting spectra of higher color temperatures will provide either better vision or equal vision compared to low color temperature lighting but at lower levels of illumination.
Luminance choice: Subsequent to the acuity measurements, we asked the participants in study A to adjust the task luminance to their preferred level. Each subject was asked, "Would you please adjust the light level for the new task lights to a level that you are most comfortable with for reading the letters". Given that the participants had just completed the acuity testing, we surmised that they would choose a lower luminance in the vicinity of what provided the best acuity, but would that be different in absent of any general lighting?
Conclusions:
An important goal of lighting practice is to provide environments that appear clear and crisp. This means that the edges of viewed objects should be well enunciated. It is not optimal just to see the objects, but to see them sharply enunciated. It is these object edges that contain high spatial frequencies and where acuity is essentially the measure of visual sensitivity. Thus, all lit environments will be optimally viewed when acuity is best. In our studies we have shown that at a given value of light level, acuity is best when the lighting spectrum has high color temperature. Since acuity generally decays with age, it is possible that the effects observed here could be more dramatic in older persons. We note that lighting retrofits replacing 3500K lamps with 5000K+ lamps have been carried out in many commercial and industrial environments where both major energy savings and improved vision have been reported11, 13. Lamps of varying color temperatures are readily available in the lamp marketplace and lighting practice should take advantage of that opportunity to enhance the efficacy and quality of the lit environment.
1- Oreskes N., et al. “Verification, validation and confirmation of numerical models in earth science, Science, V.263, 4 Feb., 1994.
2- Noguchi, Hiroki, “Effect of Illuminance and CCT on lowering of physiological activity. Appl Human Sci, 18(4):117-123,1999.
3- Harda, Tesuo, “Effect of evening light conditions on salivary melatonin of Japanese junior high school students, Journal of circadian rhythm, 2004, 2-4, doi:10-1186/1740-3391.
4- Glickman, Gena, et., al. “inferior retinal exposure is more effective than superior retinal exposure in suppressing melatonin in human Journal of biological rhythm, , Vol.18, No.1, Feb 2003, 71-79.
5- Beersma, Domien G.M., et, al., “Accuracy of circadian entrainment under fluctuating light conditions: contribution of phase and period responses, Journal of biological rhythm, Vol.14, No.4, Aug 1999, 320-329.
6- Navvab, M., et al., "Variability of Daylight in Luminous Environment", JIES, (winter 1997).
7- Navvab, M. "A comparison of visual performance under high and low color temperature fluorescent Lamps". JIES, (S-2001).
8- Navvab, M. “Design and Evaluation of the Final Paint Inspection Lighting System at Two Industrial Auto Plants, JIES, (S-2001).
9- Navvab, M. “Visual Acuity Depends on the Color Temperature of the Surround Lighting,, JIES, (winter 2002).
10- Berman, S.M., et.al., "past vision studies can support a novel human photoreceptor" CIE 2005, Leon.
11- Berman, S.M., et.al., Luminance controlled pupil size affects word reading accuracy. JIESNA- 1996., 25(1): 51-59.
12- Brainard, G.C. et al (2001), Action spectrum of melatonin regulation in humans: evidence for a novel circadian photoreceptor. J. Neurosci. 21 (16), 6405-6412.
13- Berman, S.M., et.al., "Despite different wall colors, vertical scotopic illuminance predicts pupil size" JIES, 1997 26 (2): 59-68.
14- Soonian, D., Navvab, M, “Man as a Meter , Architectural Record, September 2002.